Puerto Rico Ocean Energy Atlas: Wave Energy Maps
In order to visualize the spatial and temporal distribution of wave climate and wave energy parameters as recommended by the IEC, as part of the ocean energy atlas development we have produced very high-resolution maps of the following quantities / products:
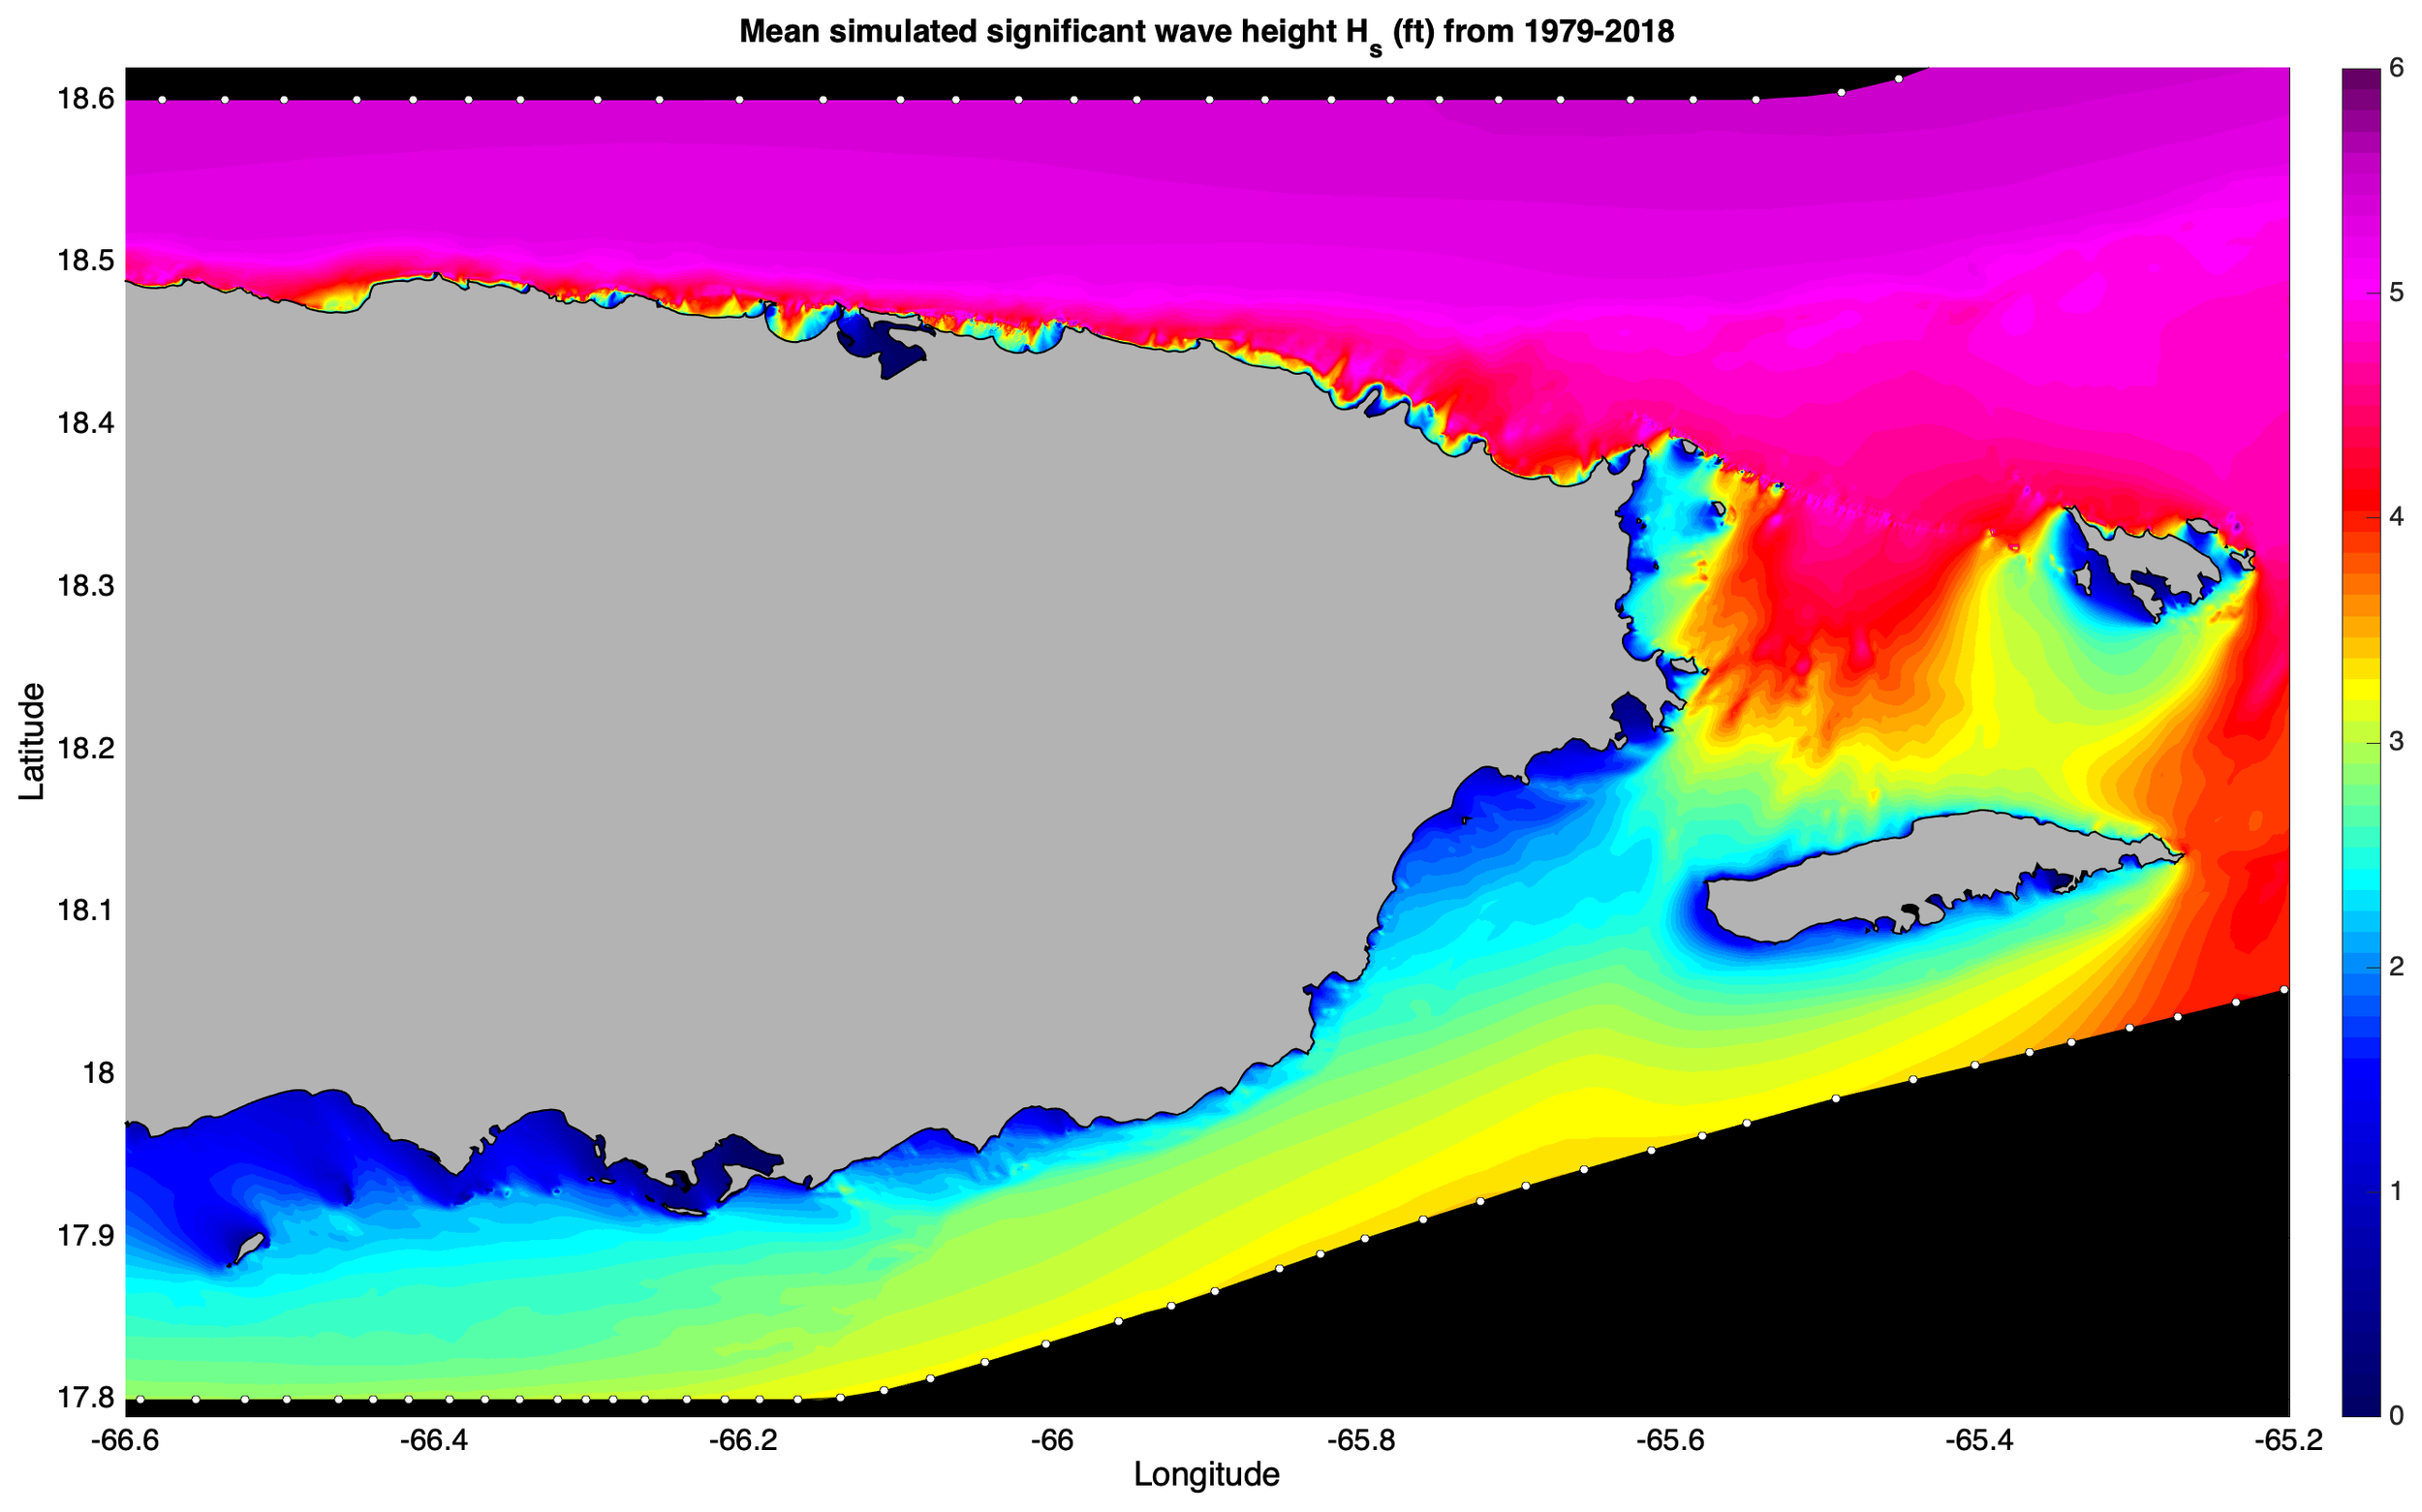
Maps of the mean simulated significant wave height (in feet) from January 1 1979 - December 31 2018 for the PR/USVI region.
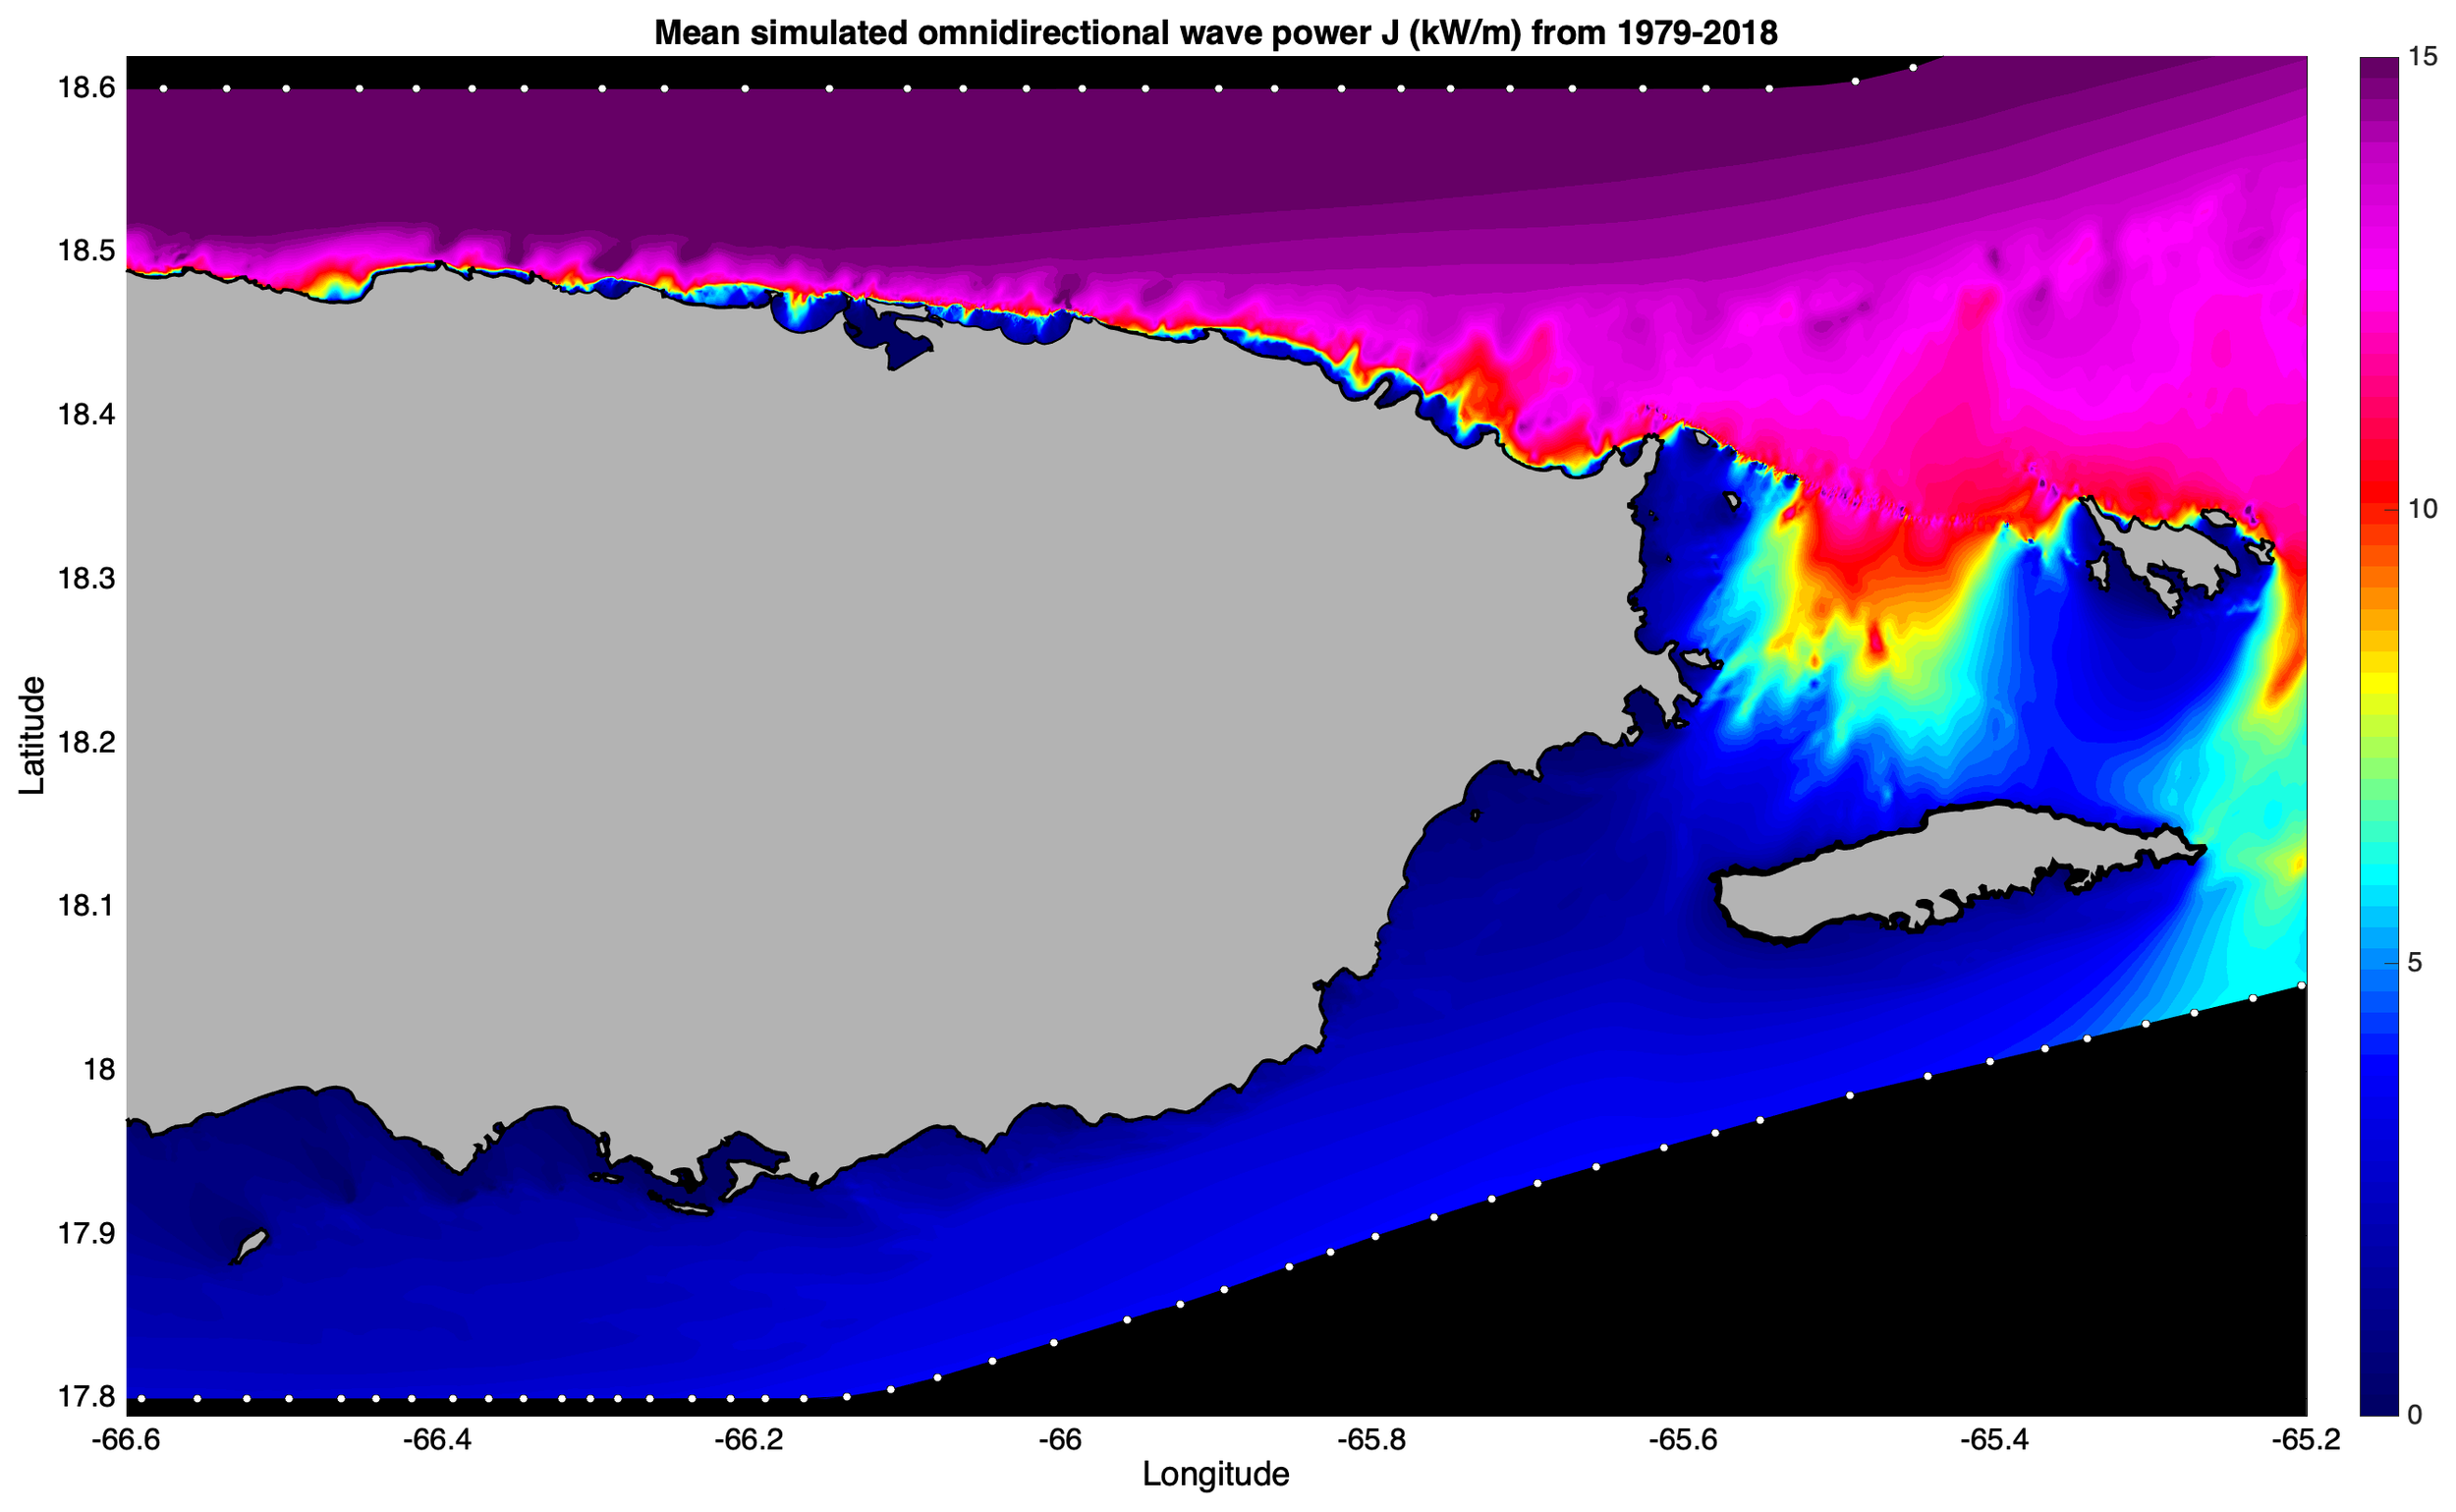
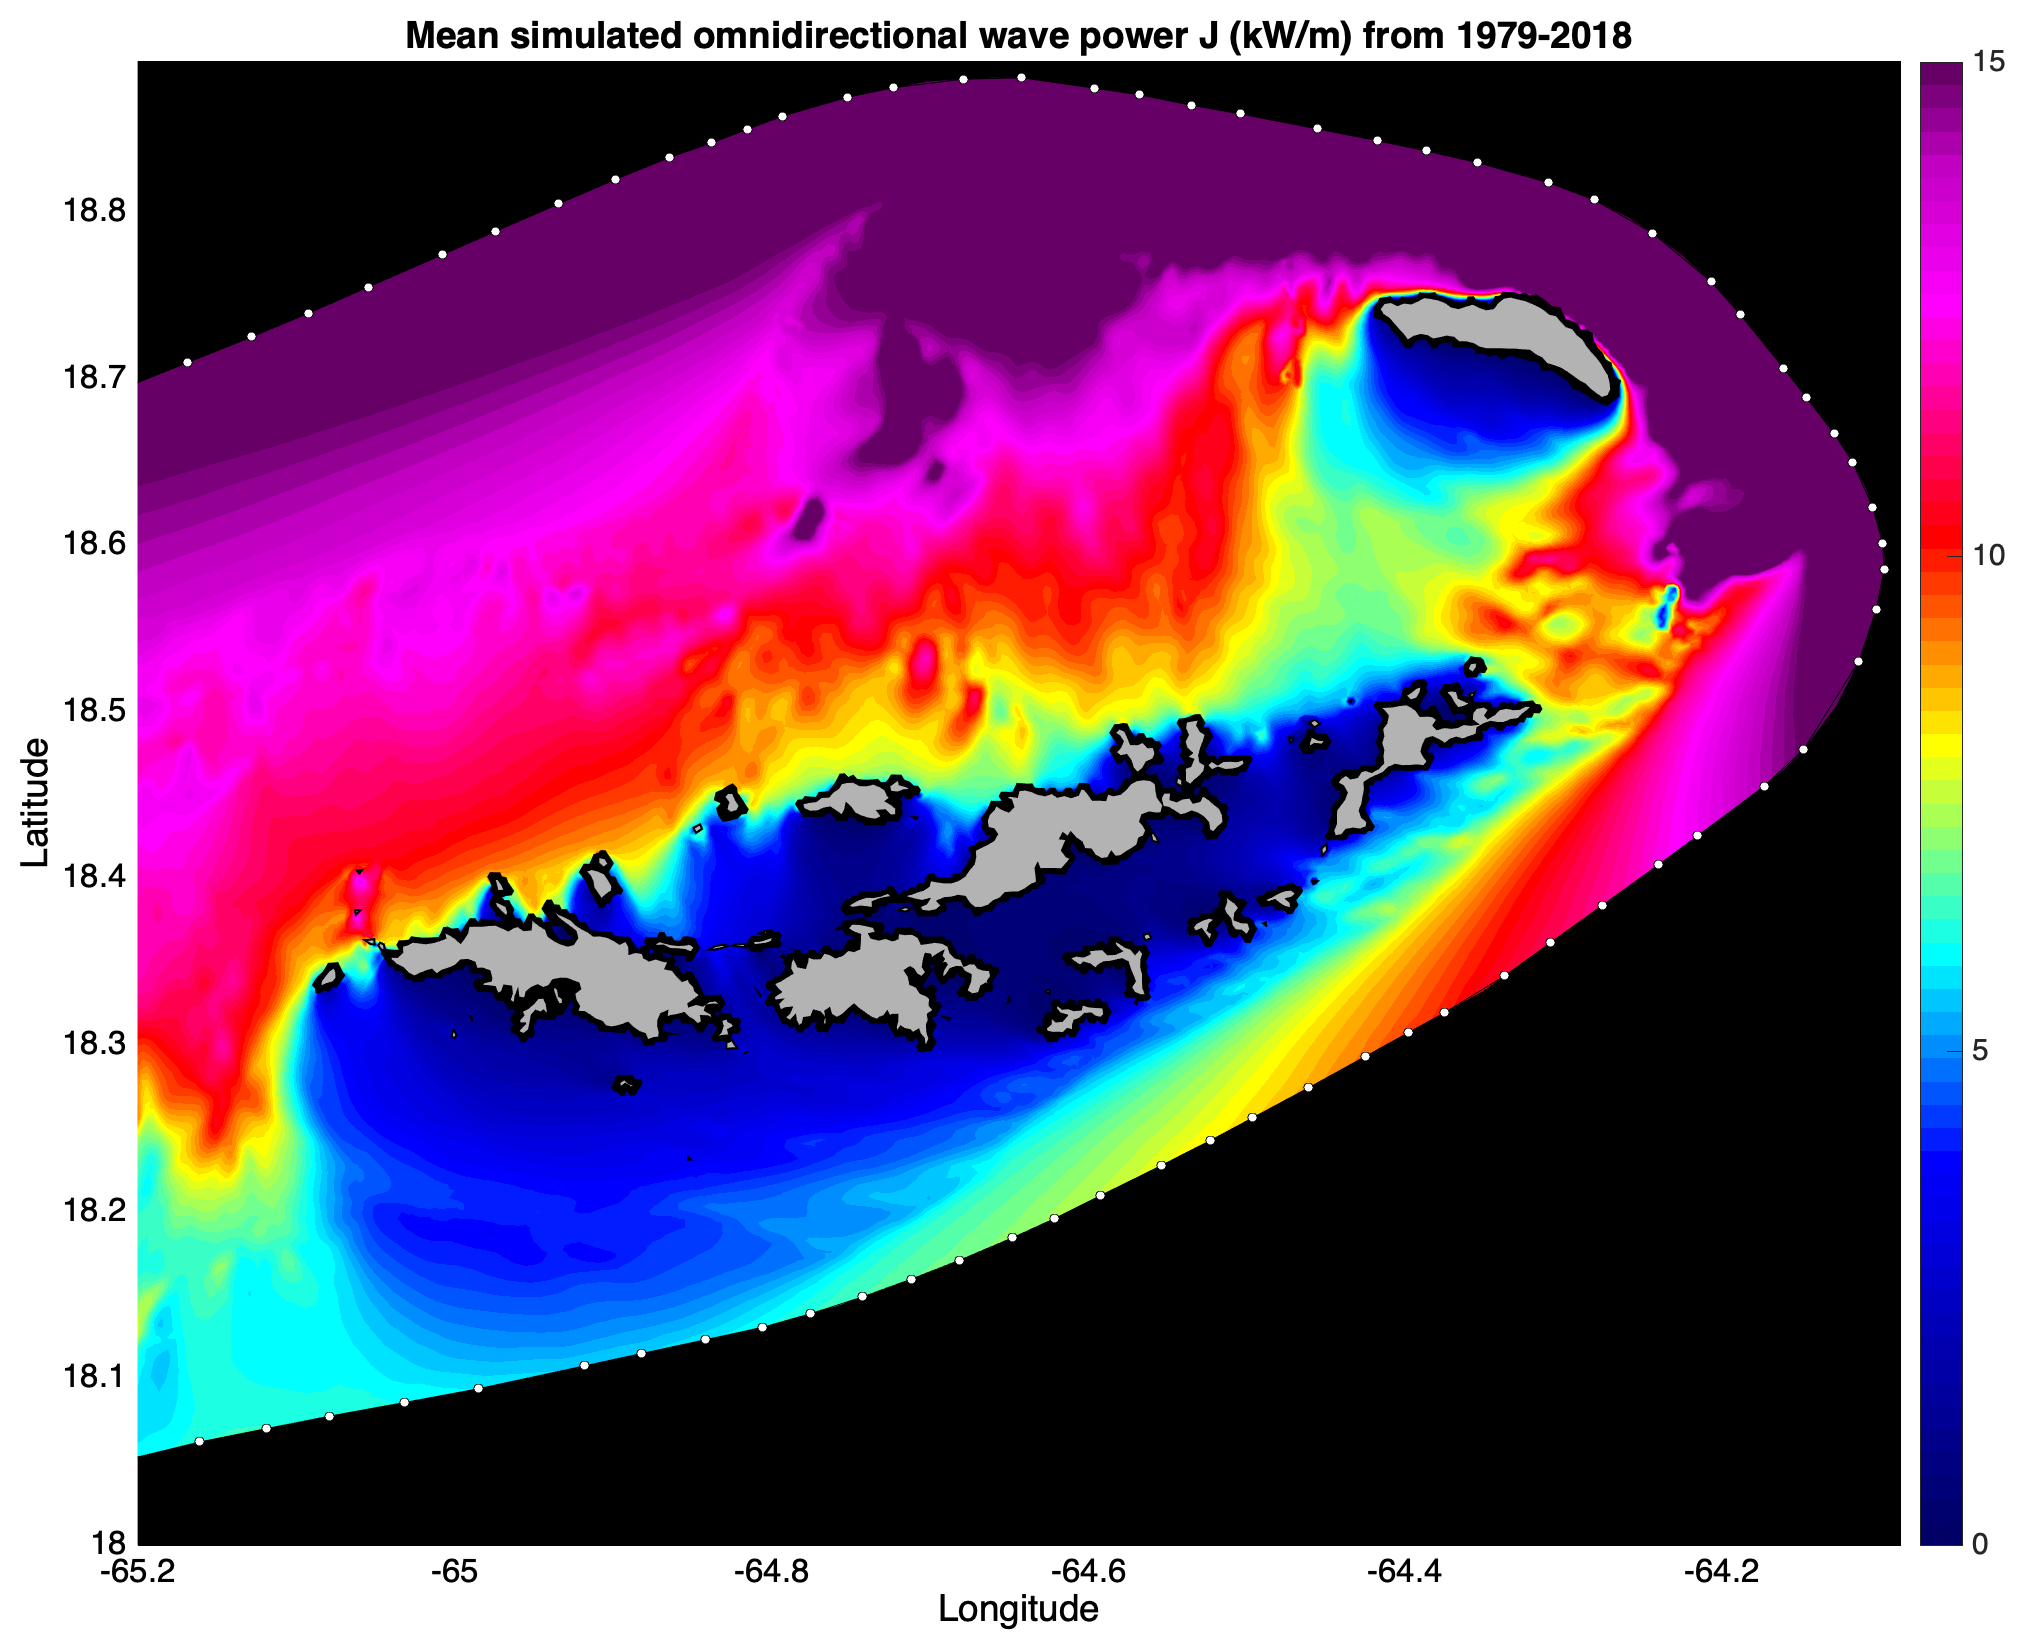
Maps of the mean simulated omnidirectional wave power (measured in kilowatts per meter of wave crest kW/m) from January 1 1979 - December 31 2018 for the PR/USVI region.
Maps of the mean simulated wave energy period Te from January 1 1979 - December 31 2018 for the PR/USVI region.
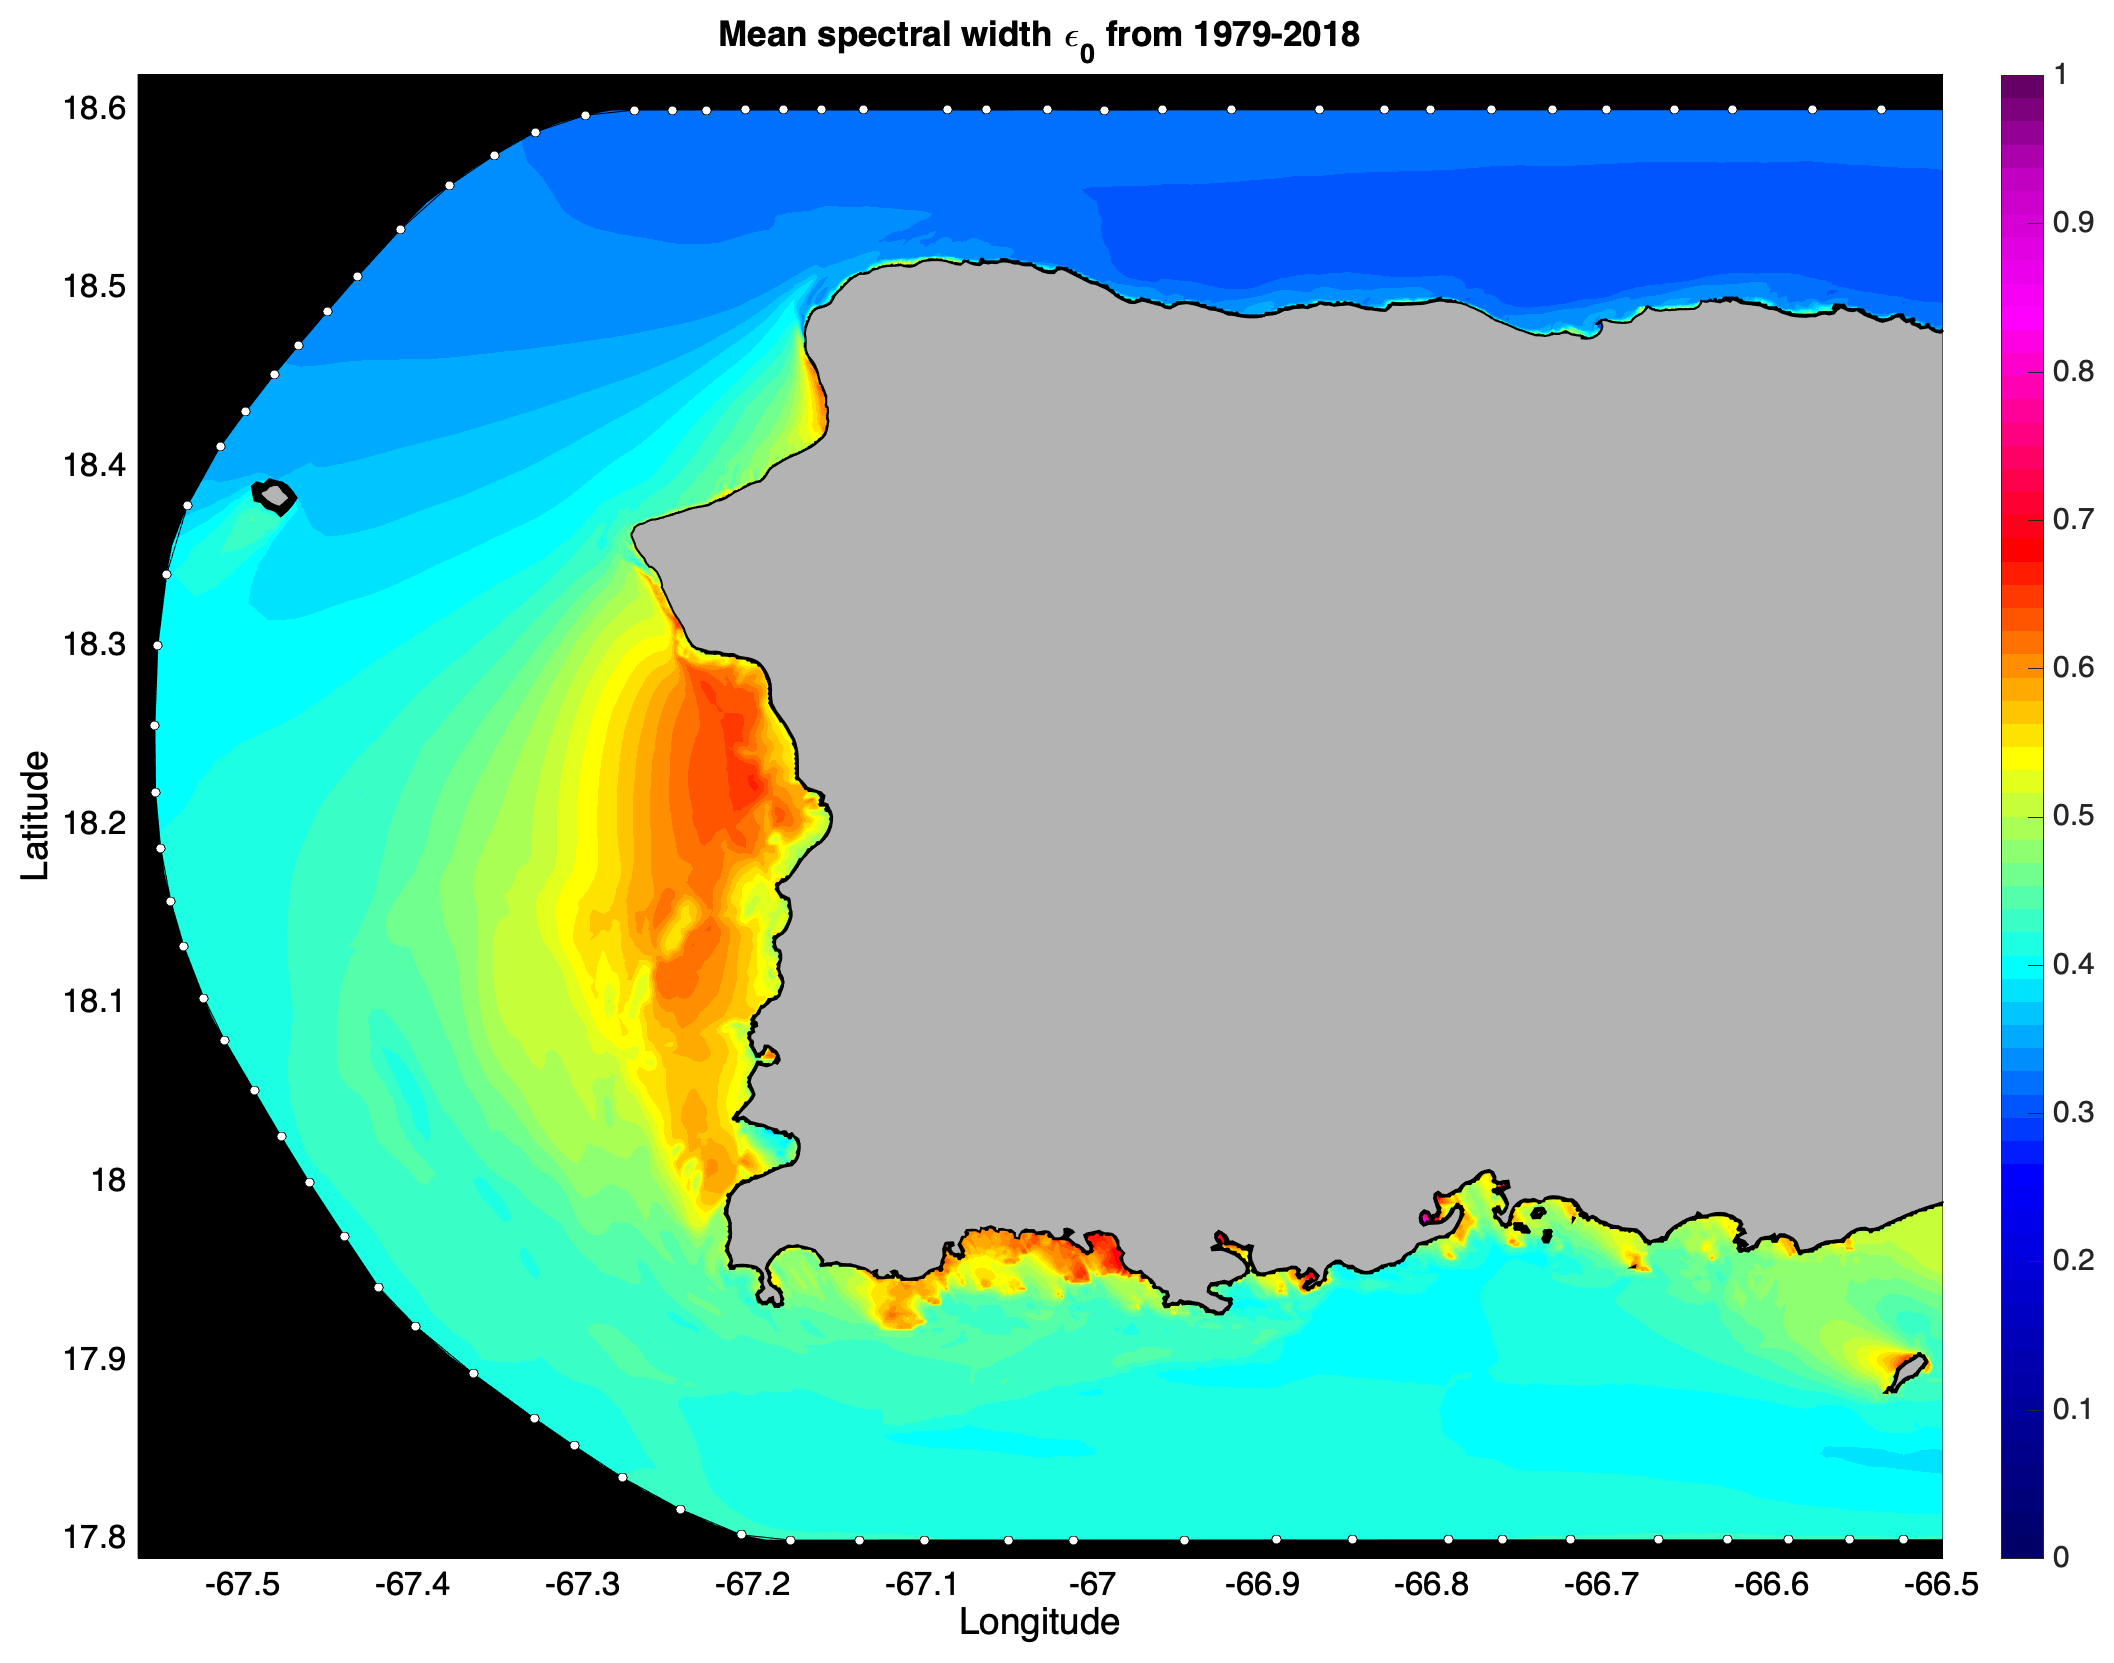
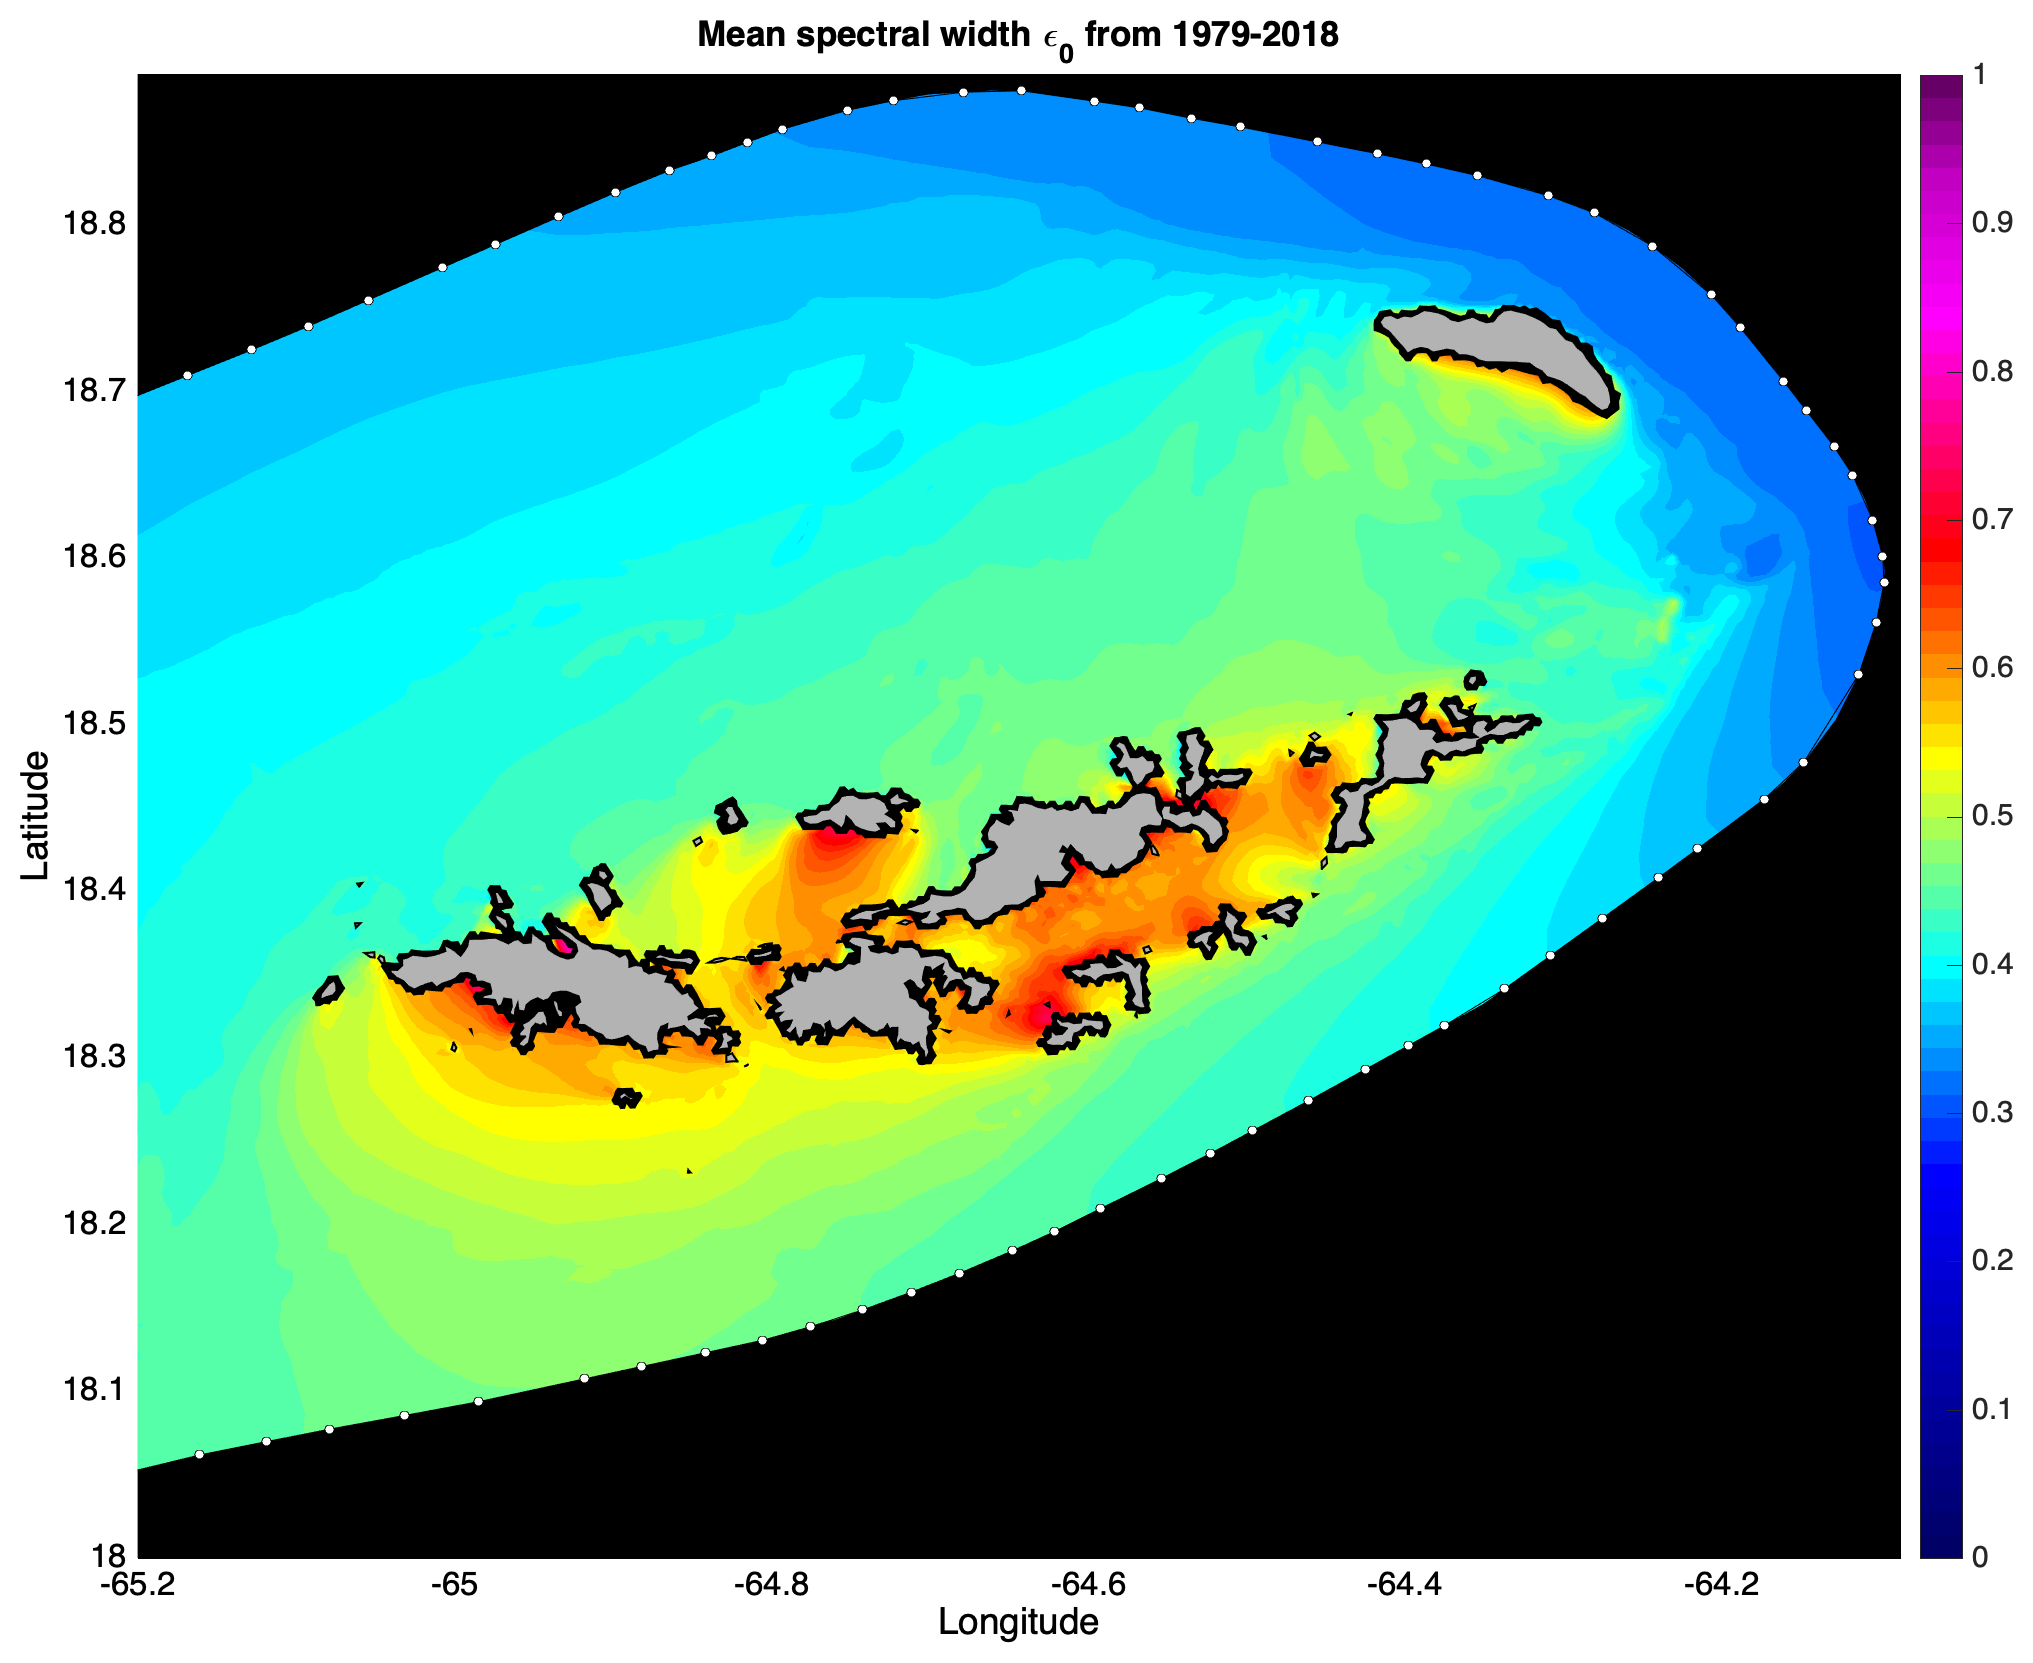
Maps of the mean simulated spectral width from January 1 1979 - December 31 2018 for the PR/USVI region.
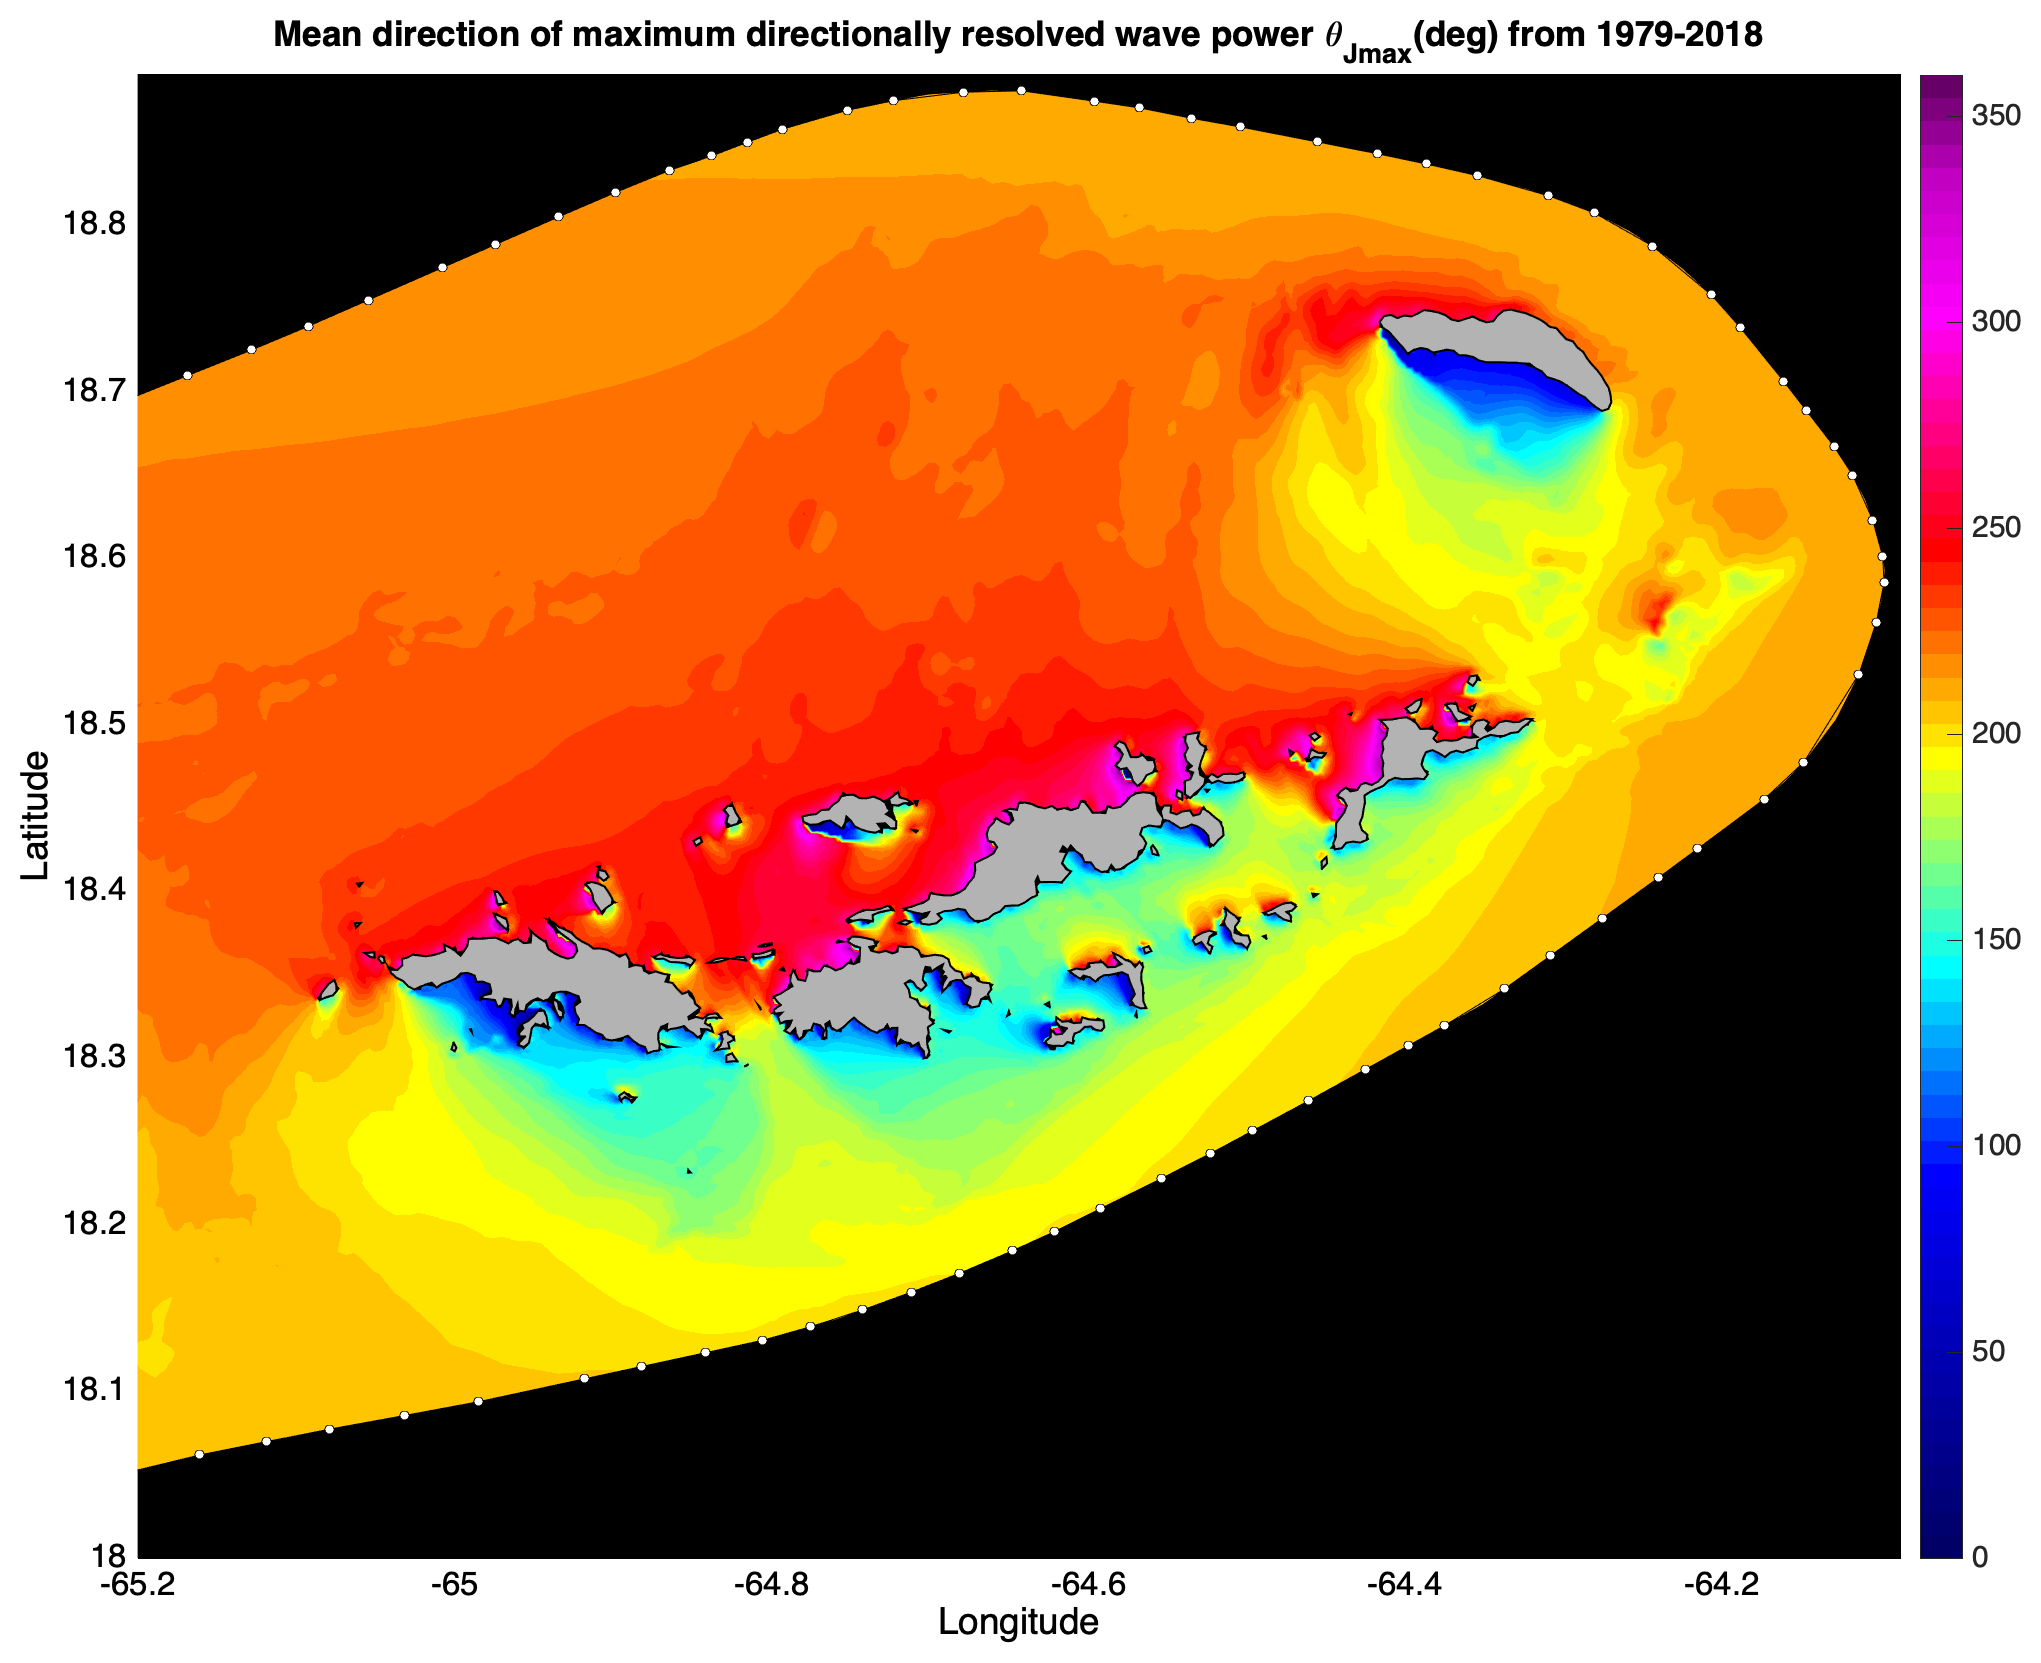
Maps of the mean simulated direction of maximum directionally resolved wave power from January 1 1979 - December 31 2018 for the PR/USVI region.
Maps of the mean simulated directionality coefficient from January 1 1979 - December 31 2018 for the PR/USVI region.
Figures for the full PR/USVI region and for three subregions (Western PR, Eastern PR and USVI - except St. Croix) are provided here. For custom products or for maps of specific regions please contact the Principal Investigator Miguel F Canals Silander via email: miguelf.canals@upr.edu.